
Interpreting the Rare: The Big Asset Transfer and its Effect on the US Economy
The current state of the economy is showing an unusual resilience to the Federal Reserve’s tightening measures.

The current state of the economy is showing an unusual resilience to the Federal Reserve’s tightening measures. It seems to be stronger than expected, which makes us curious about the reasons. The answer can be found in the data that I will show you in the following charts.
To sum up, the government has engineered a significant shift in wealth from the public sector to the private sector. This shift involved transferring wealth from the central government and central bank, and from holders of government bonds, to households and businesses. As a result of this coordinated move, the private sector has become relatively unaffected by the Fed’s fast tightening towards a more normal monetary policy. The household sector’s financial statements and balance sheets are in good shape, while the government’s finances are suffering. This shift happened in 2020 and 2021, during times of huge budget deficits and large central bank bond purchases to keep interest rates low.
The private sector’s improved financial situation has been reflected in increased net worth, lower unemployment rates, and higher compensation. On the other hand, central governments around the world, including the US, have seen their financial statements and balance sheets worsen due to rising deficits and losses on government bonds.
While the real economy seems to be in decent shape for now, the negative effects of bad government finances can’t be ignored. Governments, like individuals and companies, have debt service payments and eventually need to pay back the principal, which can be painful. Moreover, governments can resort to raising taxes or printing money through the central bank to manage their debts, and this has its own set of consequences.
Looking ahead, in the near term, we might experience moderate economic growth and relatively high inflation, resembling mild stagflation. But, in the long term, it’s almost certain that central governments’ deficits will remain large and likely increase at an even higher rate due to rising debt service costs. This could lead to a self-reinforcing debt spiral, market-imposed debt limits, and central banks printing more money to cope with losses and deteriorating balance sheets. This situation could potentially pose problems for monetary policies and central bank independence, leading to more political controls over them.
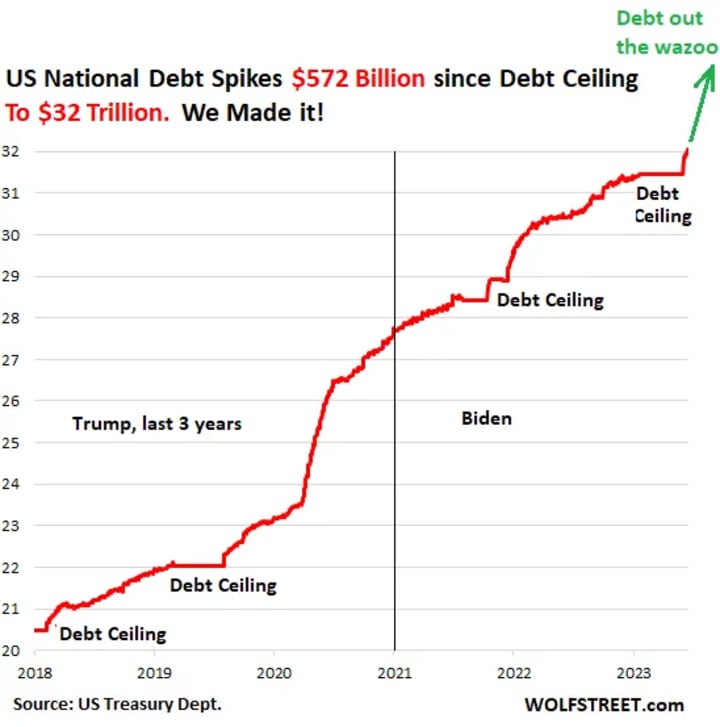
According to MacroTrends, the US debt-to-GDP ratio was 126.39% in 2020, up from 100.90% in 2019. This means that the US owed more than its entire annual economic output. The US debt reached 32 trillion dollars in March 2023, which is equivalent to about 152% of its GDP. This is a record high level that surpasses the previous peak of 118.6% in 1946 after World War II. The US debt is projected to grow further in the coming years due to the ongoing fiscal stimulus and recovery spending amid the pandemic.
The US debt situation is not unique, as many other countries are also facing high levels of public debt due to the pandemic and its aftermath. However, the US has some advantages that make it less vulnerable to a debt crisis than other nations. First, the US dollar is the world's reserve currency, which means that most international transactions are conducted in dollars and many foreign governments and investors hold US assets as a safe haven. This gives the US more flexibility and credibility to borrow and repay its debts. Second, the US has a large and diversified economy that can generate enough income and tax revenues to service its debts. Third, the US has a stable and democratic political system that can enact fiscal reforms and adjustments when needed. Fourth, the US has a strong and independent central bank that can manage monetary policy and inflation expectations effectively. These factors make the US debt more sustainable and less risky than it might seem .
Source:
(1) U.S. Debt to GDP Ratio 1989-2023 | MacroTrends. https://www.macrotrends.net/countries/USA/united-states/debt-to-gdp-ratio
(2) Federal Debt: Total Public Debt as Percent of Gross Domestic ... - FRED. https://fred.stlouisfed.org/series/gfdegdq188S
(3) US Total Debt: % of GDP, 1951 – 2023 | CEIC Data. https://www.ceicdata.com/en/indicator/united-states/total-debt--of-gdp
(4) U.S. Debt to GDP Ratio 1989-2023 | MacroTrends. https://www.macrotrends.net/countries/USA/united-states/debt-to-gdp-ratio
(5) Debt-to-GDP Ratio: How High Is Too High? It Depends. https://www.stlouisfed.org/open-vault/2020/october/debt-gdp-ratio-how-high-too-high-it-depends
(6) U.S.: National debt in relation to GDP 2028 | Statista. https://www.statista.com/statistics/269960/national-debt-in-the-us-in-relation-to-gross-domestic-product-gdp/
(7) undefined. https://fred.stlouisfed.org/series/GFDEGDQ188S
About the Creator
Enjoyed the story? Support the Creator.
Subscribe for free to receive all their stories in your feed. You could also pledge your support or give them a one-off tip, letting them know you appreciate their work.
Keep reading
More stories from writers in Chapters and other communities.
Smartystan
Flags flew freely in the summer breeze. They consisted of a gray and white human brain against a black background. Scales of gold sat just overtop the image of the organ. The sun rose at just the zenith and shared its light and warmth with the attendees to one of the country-states’ greatest accomplishments: the graduation of two women who had been in a halfway house and found their passions for art design and communications. Mala and Sheltham looked on with sunglasses and cheered the graduates. With the knowledge they had months to go before being up on that stage, they looked at each other and grinned. After the ceremony, they walked into a pizza restaurant that fit their budgets.
By Skyler Saunders12 days ago in Chapters
The Defeat of the Spanish Armada part 11
The Aftermath and Long-term Consequences #### Political and Diplomatic Shifts The defeat of the Spanish Armada had significant political and diplomatic repercussions. It emboldened other European powers to resist Spanish dominance. The Dutch, who had been fighting for independence from Spain, were particularly encouraged by the Spanish defeat. The Dutch Revolt continued, and the Northern provinces eventually secured their independence, forming the Dutch Republic.
By Daily Readabout 4 hours ago in Chapters


Comments (1)
Its really a indepth analysis and great article