
A Closer Look at the Diverging Signals from U.S. Employment Surveys
With Special Insights From BrightQuery


Some economy watchers have been surprised by the faster employment growth recorded by the U.S. Establishment Survey, ES (used to compute non-farm payrolls) versus the Household Survey, HS employment (used to calculate the national unemployment rate). The Bureau of Labor Statistics, which compiles this data, argues that the ES is more closely linked to economic growth because it includes 80% of workers who contribute to real GDP. In contrast, others believe the HS is better at capturing turning points in the economy because it measures the number of people employed rather than the number of jobs.
Still, the June 2024, U.S. employment report (released on July 5, 2024) revealed a +206 rise in non-farm payrolls, but sharp downward revisions to the two previous months suggest some cracks are developing in U.S. labor markets. Much of the strength in employment was in the government sector, as predicted by the JOLTs Survey, which previously revealed a jump in government job openings. That can be observed by the increase in the unemployment rate to 4.1%, higher than the 3.9% rate expected by markets.
The closely followed Sahm Rule, which signals a potential recession is unfolding when the 3-month moving unemployment rate exceeds its lowest reading over the previous 12 months by 0.5 or higher, moved up to .43 in June 2024 versus .37 in May 2024. Although this reading wasn’t enough to trigger a recession call, the federal funds futures market is now pricing a higher 72% probability of a policy rate cut for the September 2024 FOMC meeting. On the inflation front, it was encouraging to see the average hourly earnings monthly rise of +0.3%, which beat the corresponding monthly inflation rate and is now rising yearly by +3.9%.
The Divergence of U.S. Employment Surveys
The discrepancy between U.S. employment surveys reminds me of Jay-Z and Alicia Keys’ iconic song, “Empire State of Mind.” The hit (released in 2009) is a modern anthem for New York City that captures the dual experience of the glamorous lifestyle some enjoy while highlighting the struggles others encounter in the rougher parts of the city where I was born and raised. The song has also gradually replaced older New York anthems. Below are some inspiring words from the song:
“These streets will make you feel brand new. Big lights will inspire you. New York, New York. [But]… Sidelines is lined with casualties who sip the life casually. Then gradually become worse -- don’t bite the apple, Eve.”
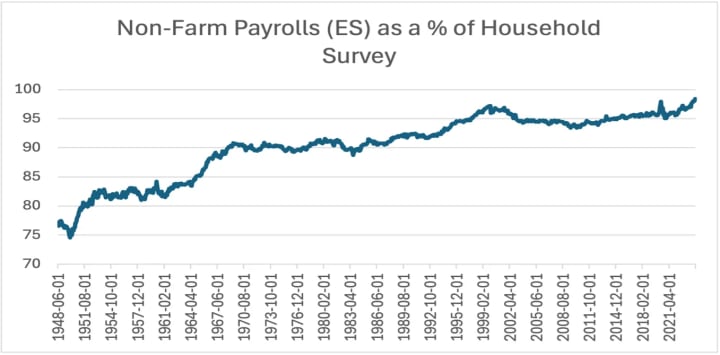
On a year-to-date basis, the ES is up +1.334 million versus the HS, which is up a meager +16 thousand. However, a more critical question may be: Is the discrepancy between both employment surveys due to computation errors, changes in the composition of part-time versus full-time employment, immigration, or the U.S. business cycle? The short answer may be all the above, but it could be helpful to unpack these issues separately.
Impact of U.S. Immigration Flows
Without making any judgments about immigration, which we leave to the reader, we must point out that in recent years, the U.S. immigrant share of the U.S. labor force has hovered around 20%. However, a surge in immigration in 2024 has likely pushed that share significantly higher. Due to a younger demographic, immigrants have a higher labor-force participation rate (LFPR), e.g., 67.1%, versus the general population (e.g., 61.8%). Immigrants tend to be younger than the rest of the U.S.-born population, and LFPRs are higher for younger cohorts. So, when the BLS uses the general population LFPRs considering the solid immigrant inflows, it will underestimate employment. A rise in the June 2024 LFPR to 62.6% (e.g., +0.1%) also reflects the growing impact of immigration.
The Center for Immigration Studies estimates that the labor force of U.S. immigrants with work permits rose by 2.9 million between 2019 and 2023, while U.S.-born workers declined by 183 thousand. In contrast, the Establishment Survey is less impacted by this phenomenon because it counts anonymized workers by employers across 630 thousand worksites compared to the Household Survey, which surveys 60 thousand U.S. households monthly. There is also a growing suspicion that immigrants are less likely to answer employment questions truthfully when they get a call from the government due to concerns the government may potentially use the information collected to deport them in the future.
As a sign of the importance of immigration flows, the Dallas, TX Federal Reserve Dallas, released a study on July 2, 2024, estimating that immigration will increase the number of U.S. workers by 5.2 million by 2033 and tax revenues by $1.2 trillion from 2024 to 2034. They also estimate the U.S. federal budget deficit will drop by $900 billion over the next decade due to tax collections from immigrants.
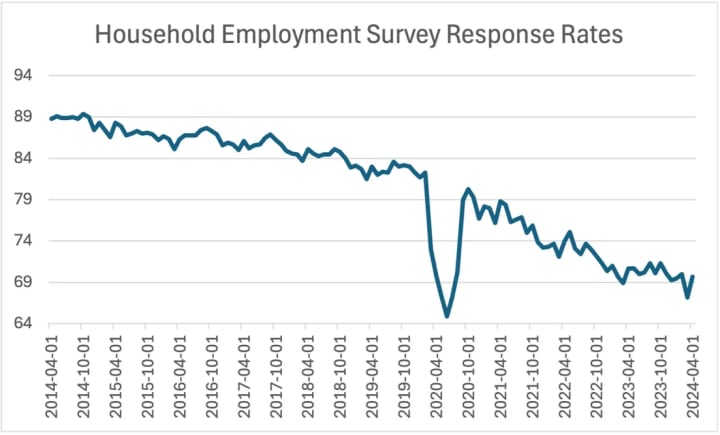
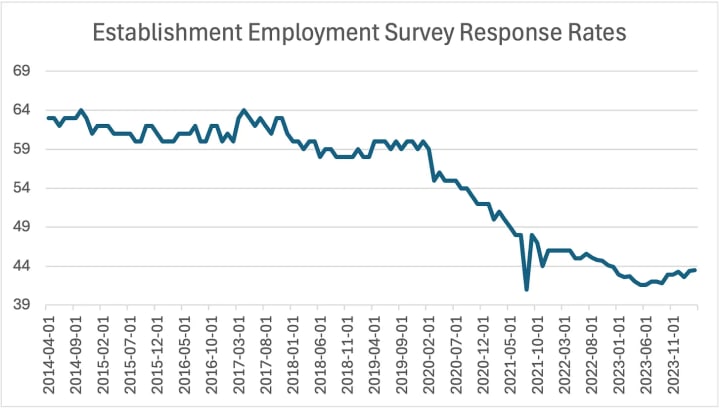
Employment Survey Response Rates Plunge
Another critical source of distortion is lower employment survey response rates, which have dropped sharply in recent years, making them less reliable. This was especially true during the height of the global pandemic, and after a brief recovery, the downward trend has resumed.
A Better Measure of Employment
In contrast, BrightQuery (BQ) generates its employee headcount data directly from all the tax jurisdictions within the United States and is not subject to these measurement challenges. This ensures superior data quality since the entire labor market is measured monthly instead of using a subsample.
Consequently, as the number of immigrants with work permits and new company births has risen, the number of employed workers should have increased. However, if such counts have been underestimated, it may explain why the official employment figures, especially the Household Survey, which depends heavily on population estimates, may have been underestimated. This hidden source of employment may also explain why consumer spending has remained relatively buoyant even after the massive stock of pandemic savings has evaporated.
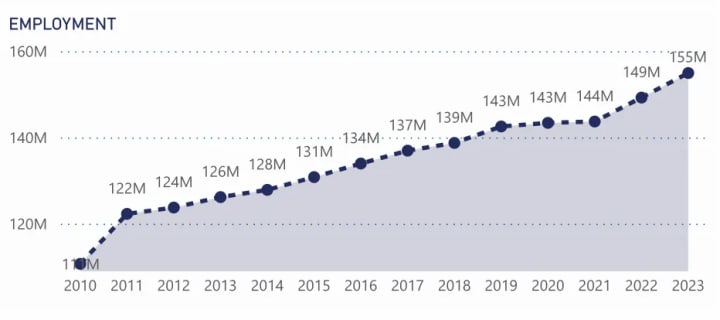
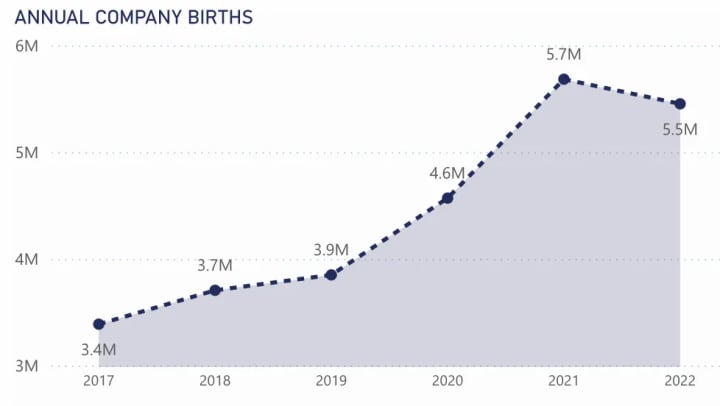
Not surprisingly, BQ estimates total employment rose by 8.4% through the end of 2022 compared to growth of 3.6% and 1.4% for the Establishment and Household Survey. Another reason for the more robust employment growth in the BQ data is that we experienced a surge in new company births after the pandemic, as many workers dropped out of the labor force and opted to start small businesses. Although this trend eased in 2022, self-employed employees experienced a significant uptick during 2020 and 2021!
Another Source of Strength for the Establishment Survey
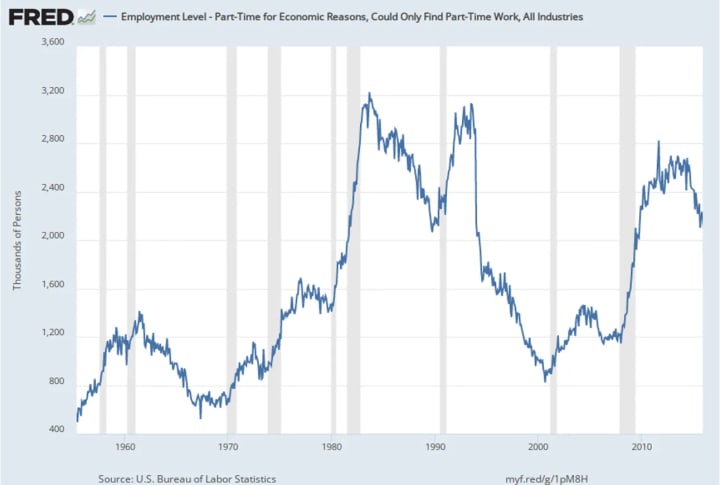
U.S. immigrants are also more likely to hold multiple part-time jobs, which boosts the ES relative to the HS, which counts only the number of employed workers. Conventional wisdom assumes that when immigrants first enter the U.S. labor market, they are more likely to seek part-time employment (for economic reasons) due to their diminished labor market leverage. As immigrants gradually assimilate into the U.S. workforce, they often move to regular part-time jobs before securing full-time employment. The upward trend in the number of part-time workers has tended to boost the ES relative to the HS.
Impact of the Business Cycle
Lastly, some believe the HS tends to weaken relative to the ES as an economic expansion matures and approaches its demise. The average economic expansion, dating back to 1957, lasts 5.7 years. If this were an average expansion, it would end around November 2025, which may explain the recent softer readings in the HS. In June 2024, the HS employment rose by +116 thousand relative to the ES +206 thousand employment gain.
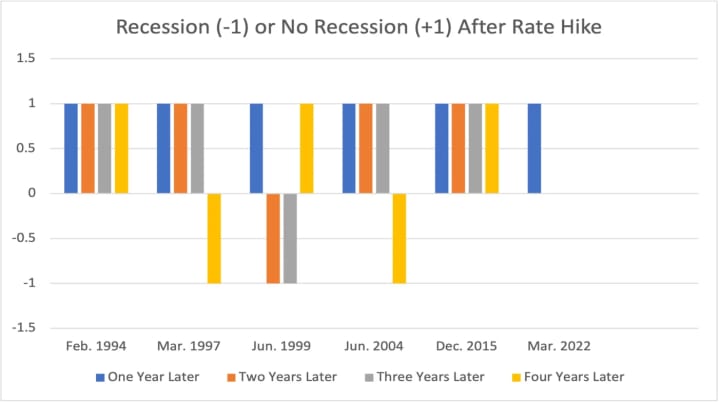
Although federal funds rate hikes don’t always lead to recessions, below is a summary of our analysis, which reveals that restrictive policy actions have often led to economic contractions two to four years after the Federal Reserve begins a rate-hiking cycle. The last rate-hiking cycle started in March 2022.
Summary and Concluding Thoughts
The relative strength of the ES relative to the HS should not be surprising, given the impact of U.S. immigration flows, measurement errors due to lower employment survey response rates, and the upward trend in part-time employment. On a year-to-date basis, ES employment is up +1.334 million while HS employment is up +16 thousand!
In contrast, BQ’s employment data, less subject to measurement distortions arising from U.S. immigration flows and changes in new company births, has reported faster employment growth over the last couple of years than both official U.S. employment surveys.
The good news is that, like the iconic song, “Empire State of Mind,” BQ’s data provides a complete picture of U.S. labor market conditions.
About the Creator
Anthony Chan
Chan Economics LLC, Public Speaker
Chief Global Economist & Public Speaker JPM Chase ('94-'19).
Senior Economist Barclays ('91-'94)
Economist, NY Federal Reserve ('89-'91)
Econ. Prof. (Univ. of Dayton, '86-'89)
Ph.D. Economics
Enjoyed the story? Support the Creator.
Subscribe for free to receive all their stories in your feed. You could also pledge your support or give them a one-off tip, letting them know you appreciate their work.
Keep reading
More stories from Anthony Chan and writers in Trader and other communities.
What Has Been the Federal Reserve’s Biggest Policy Misstep?
Without a doubt, it was waiting too long to raise its policy interest rate (e.g., the federal funds rate) until inflation rose to unacceptable levels. Nonetheless, what eludes most Fed critics, who seem to believe this is the Federal Reserve’s most significant blunder of all time, is that this has happened many times before. Although making the same mistake more than once is not a valid defense, we seek to set the record straight on this issue.
By Anthony Chanabout a month ago in Trader
Want to Be a Wealthy Writer? Know How Language Works
If you aspire to be a wealthy writer, you have to know how and why language works. It’s pointless to argue that one use of a word or phrase is absolutely correct and all other forms are dead wrong. There is often not a perfect rule for writing, or even punctuating, since several things impact any language, some without much forewarning. Bang! OMG suddenly appears as a WORD in the freaking Oxford Dictionary!
By Maryan Pellanda day ago in Writers


Comments (1)
Thank you for the interesting and delicious content. Follow my stories now.